Data directly to your PC or Smartphone.
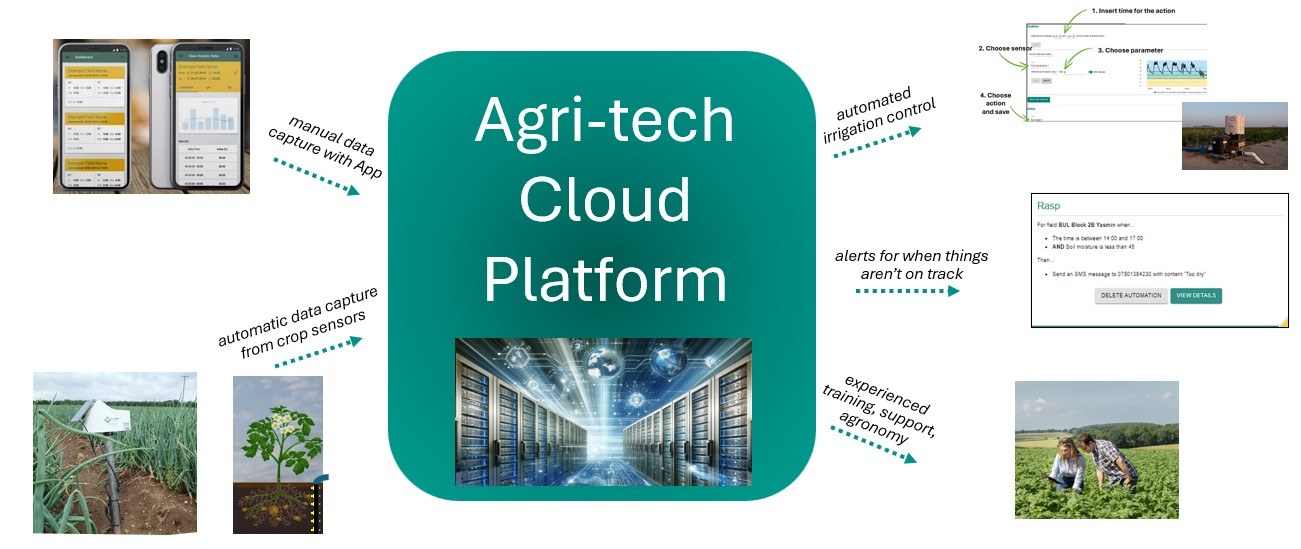
The unique new Soil dashboard provides all the necessary information in one easy to read screen. For each field displayed see the crop water use in mm, SMD in mm, the irrigation trigger displayed as an SMD and predicted irrigation date.
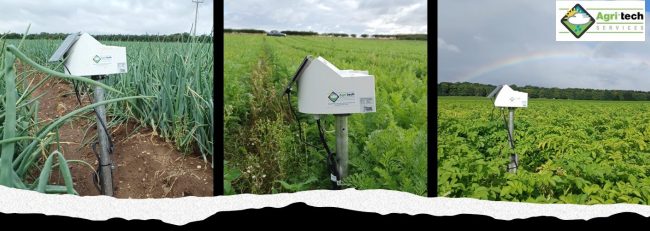
The hardware consists of a soil moisture probe inserted into the soil with sensors placed at 10cm increments. The probe is connected to a GPRS modem powered by a battery and solar system. The package is designed to be a stand-alone once installed into the desired crop. Data is then sent to a remote server, interpreted by Agri-tech's experienced team and published to the web. The User then accesses the data using their login details giving them access to the Agri-tech web portal to view all data.
Clients have access to up to date data enabling them to make speedy decisions when it comes to scheduling their irrigation. The easy to view dashboard gives a quick and visual update to the soil moisture status across the farm.
Take the guesswork out of irrigation by knowing exactly the soil mositure status of each of your crops. Knowing how effective that overnight rainfall was to your soil moisture status for example, offers the opportunity to make optimum use of farm labour and hardware.
From the platform there are a series of charts. The Rootzone moisture content graph summarises the rootzone moisture content indicating the soil moisture deficit, and where moisture sits in relation to Field Capacity and the irrigation trigger. The individual sensor graph indicating where the crop is using its water, the crop daily water use chart indicating crop use in mm per day, and the soil temperature at each depth. If the probe has conductivity then the Ec or conductivity at each depth will be displayed - indicative of the soil's nutrient levels.
An automatic rain-gauge provides accurate information on not only site specific rainfall events but overhead irrigation events too, and other sensors such as temperature and humidity can be added if so desired.
The unique Agri-tech system combines "real-time" field data, Smart Sensors and agronomic expertise to deliver water exactly when and where your crop needs it.
Agri-tech Services - Turning data into better decisions


