Strawberry Powdery Mildew Forecasting Model
With rising costs of Pesticides, fuel and labour, and margins being squeezed still further, there has never been a better time to consider using intelligent disease prediction models as part of a management support system. The strawberry Powdery Mildew Model is no silver bullet, however if used intelligently and as part of an integrated solution, it can help significantly in the decision making process, in turn leading to a more precise proactive approach to the control of the disease.
"Yes system was very user friendly. Very easy to use and also to enter in data such as when sprays have been applied".
"I didn’t solely rely on the system this year for all decisions but for the one block that we used it on we didn’t have an issue with mildew in there. Will use more next year."
"This season, following the Mildew Model I would say, has been our ‘cleanest year’ in terms of Mildew, with no outbreaks at all."
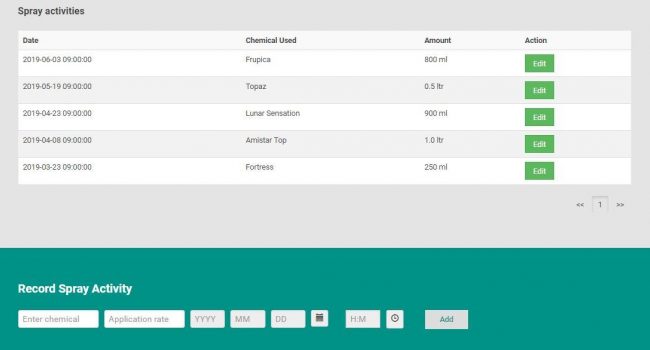
By using the system the grower is able to use fewer fungicide sprays by targeting with precision.
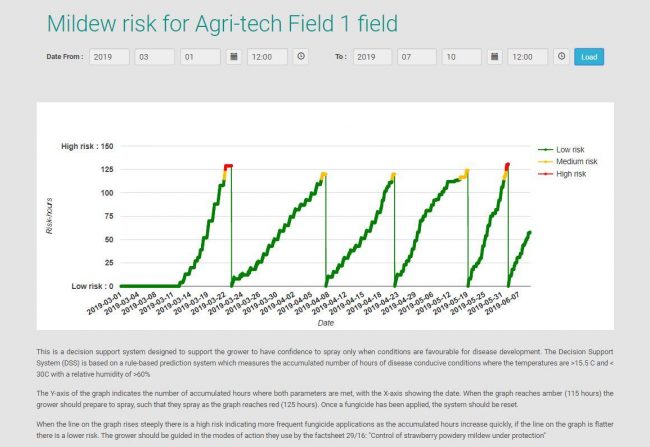
A decision support system (DSS) designed to support the grower for the intelligent use of fungicides, spraying only when conditions are favourable for disease development. The prediction system accumulates the number of hours needed for the fungus to grow from spores to producing the next generation of spores.
The development of disease epidemic contains three phases (Fig 1 below.):
a. Lag Phase: Spore germination, and fungus growth to spore production. Not enough disease development to be detected by naked eye, though early symptoms (cupping) may be visible. Length of lag phase governed by the number of disease conducive hours1
b. Log Phase: Fungus grows and spreads exponentially (i.e. doubles in each time period) at a speed governed by the number of disease conducive hours; the quicker the disease conducive hours accumulate the faster the fungus grows, and the steeper the line of the exponential phase
c. Stationary Phase: No healthy tissue left to be infected
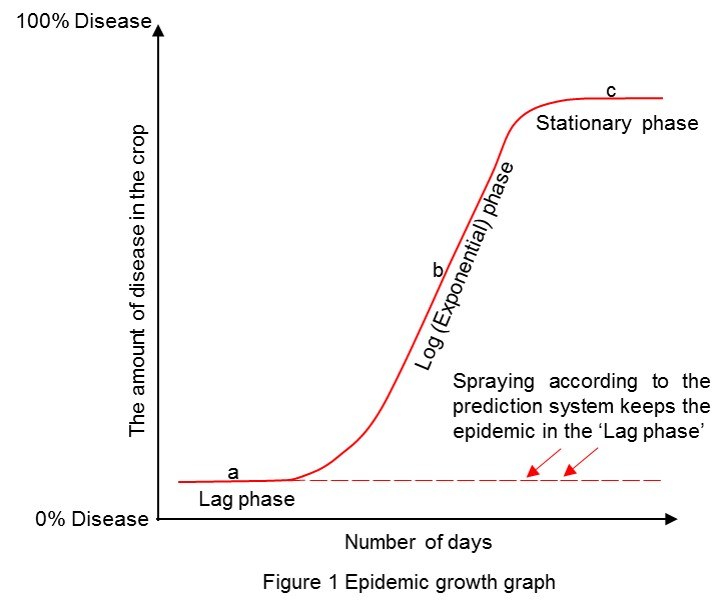
Figure 1(above): a typical epidemic curve, and also shows how disease levels can be kept to a minimum if spraying using the prediction system.
Figure 2(below): the number of disease conducive hours needed for each cycle of spore production.
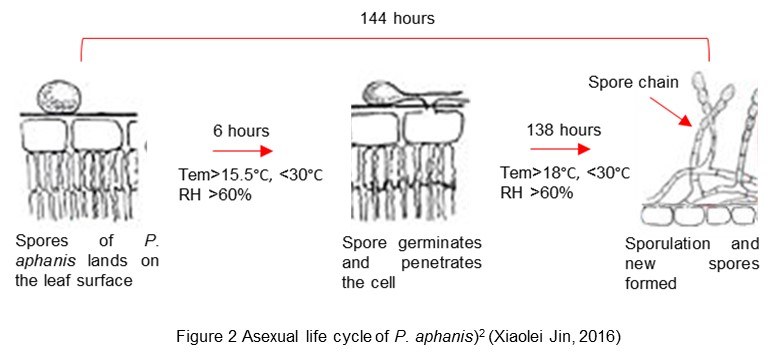
1. Disease conducive hours: the number of hours of correct environmental conditions for a particular fungus to grow. For Podosphaera aphanis (Strawberry powdery mildew) the conditions are temperature >15.5°C and <30°C (15.5°C is the minimum temperature for spore germination, whereas 18°C is the minimum temperature for sporulation; see Fig. 2), with relative humidity (RH) >60%.
2. Full life cycle of strawberry powdery mildew, disease characteristic and controlling strategies are available on the AHDB Factsheet 29/16 ‘Control of strawberry powdery mildew under protection’.
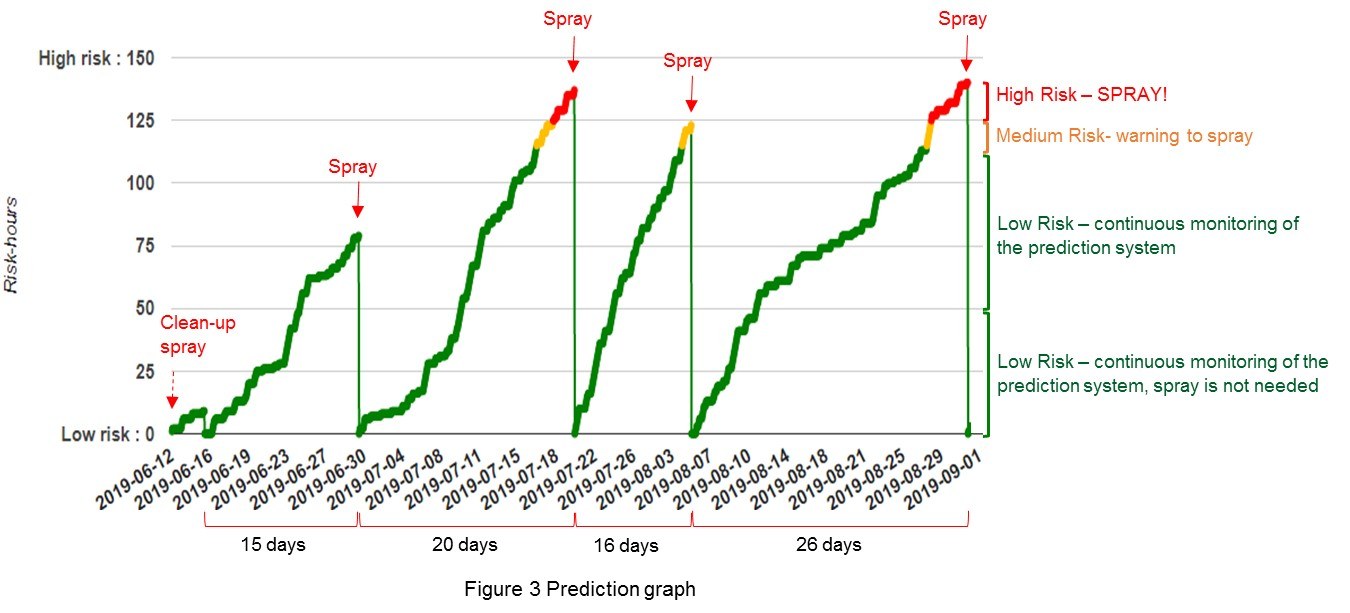
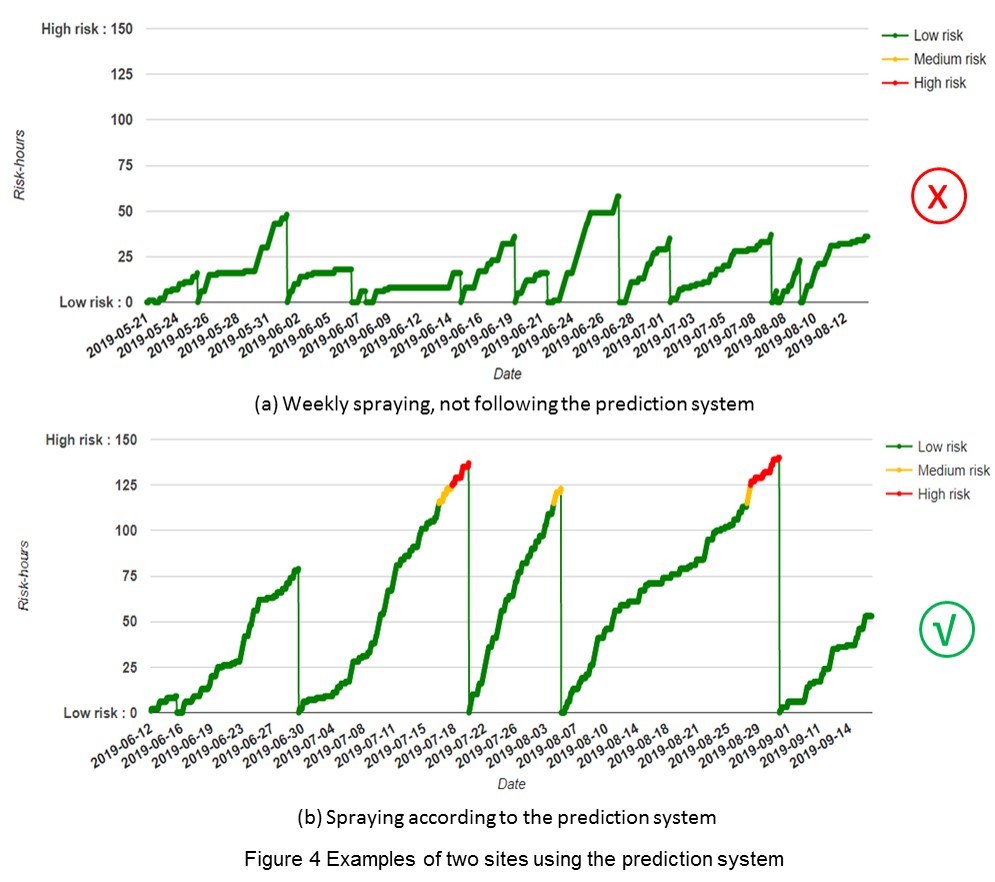
Figure 3 Prediction graph
The Y-axis of the prediction graph indicates the number of accumulated hours where both parameters are met, the X-axis showing the date. When the ascending green line turns to amber (at 115 hours), this is a warning for the grower to prepare to spray. When the line turns to red (at 125 hours), a fungicide spray is needed. At 144 hours, the fungus can start to reproduce and produce spores, i.e. initiate an epidemic if the grower has NOT sprayed. After spraying, grower enters fungicide details and resets the system, which then starts to accumulate disease conducive hours.
Points to be noted: