View all your data in one place from Moisture in your pots, to VPD, to Ec at the dripper - it's all at your fingertips in the new Dashboard
The dashboard sets out to display all data coming in from your SMART sensors in the field into one central location, enabling instant evaluation on the latest data. Making the right SMART management decisions quickly and efficiently has to be reality in today's digital age making the sensors "earn" their keep
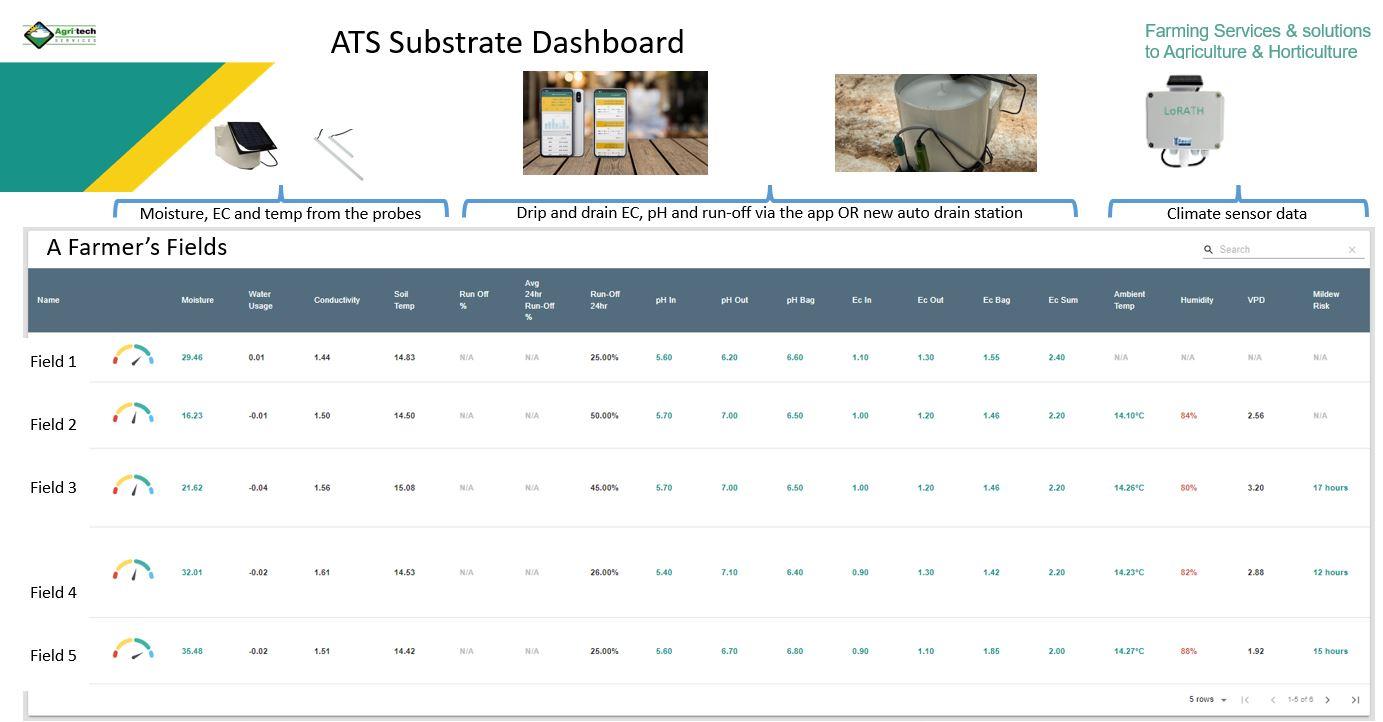
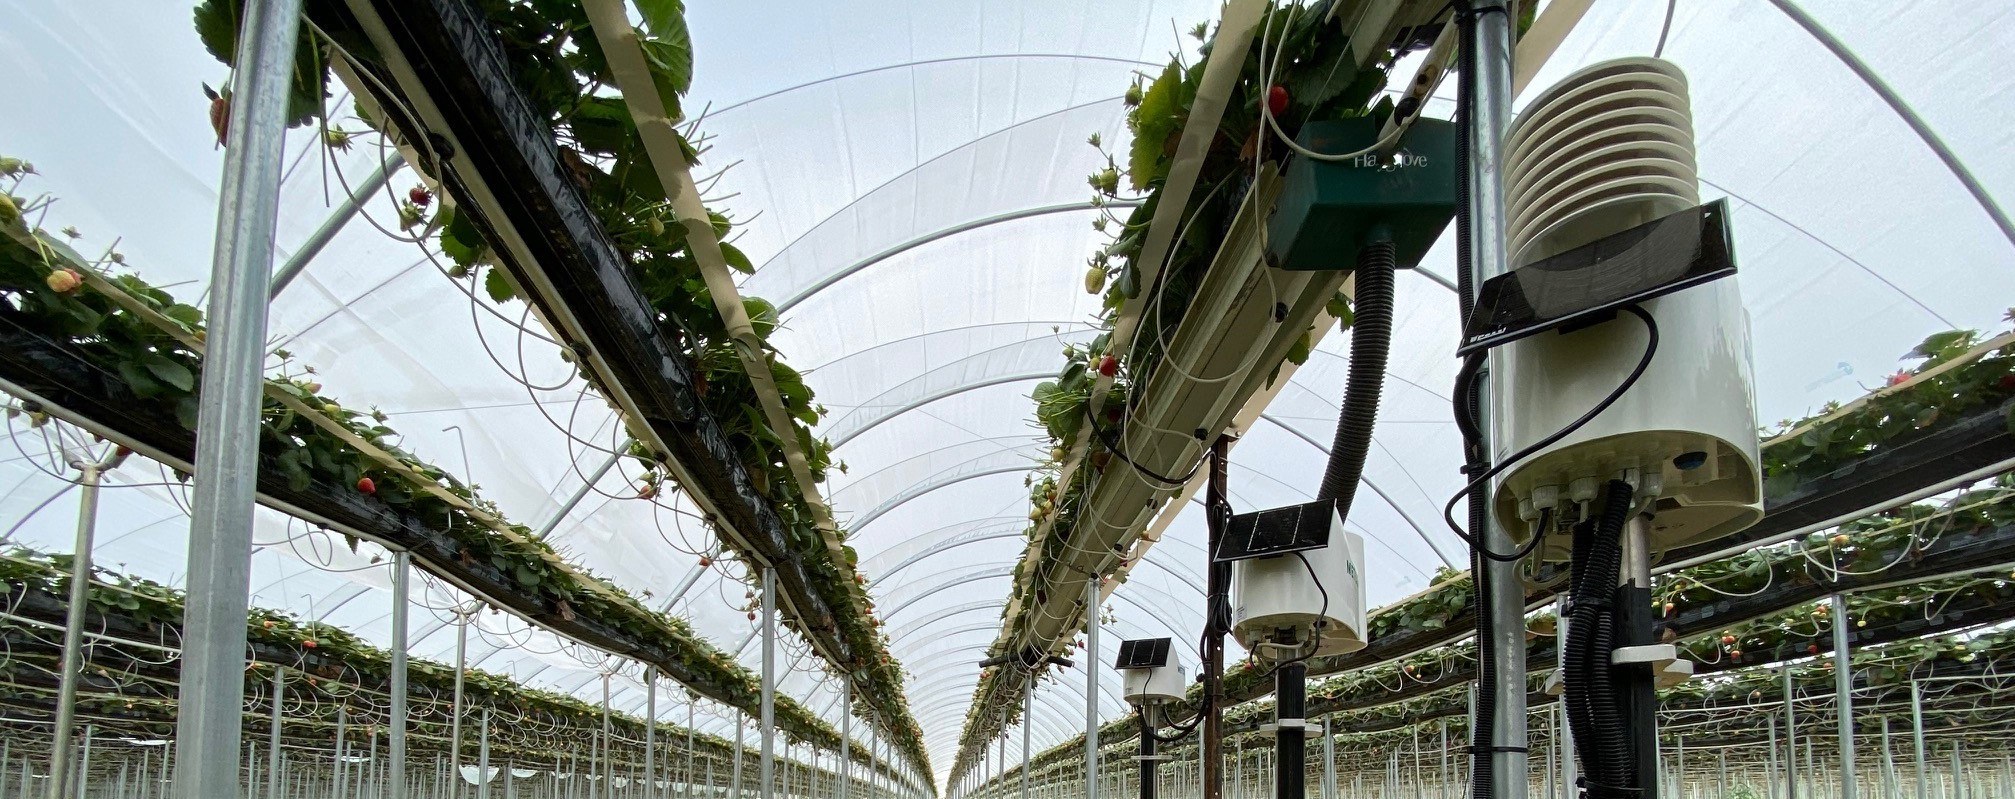
Figure 1 - SMART Sensors in Table Top Strawberries
Below summary of fields on the farm indicating status of each block
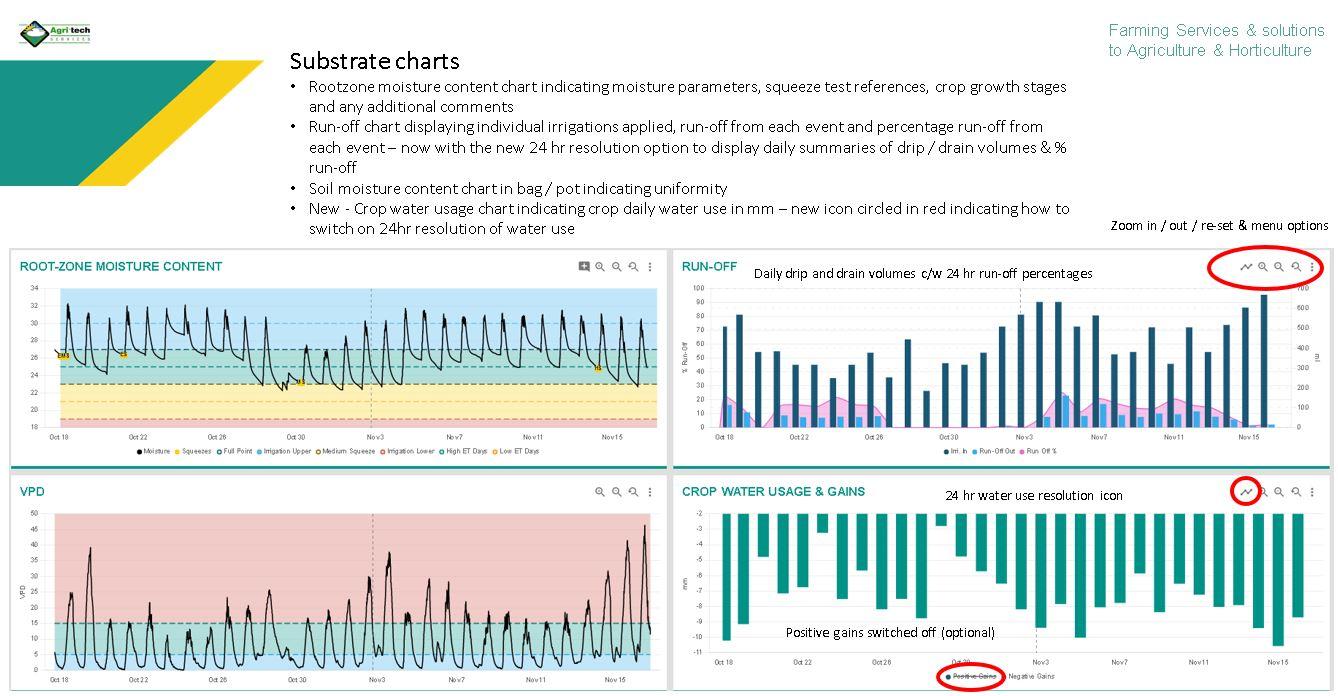
Figure 2 - Moisture graphs from irrigation probe data & run-off chart
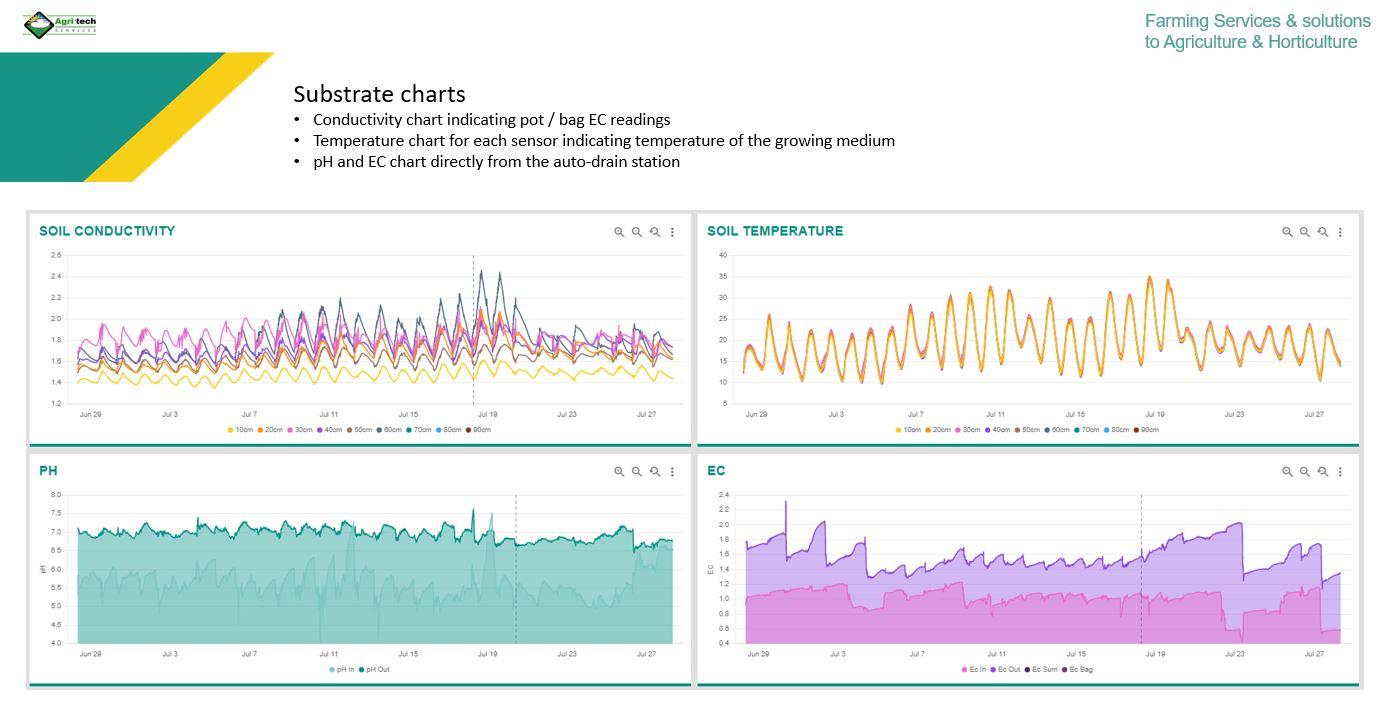
Figure 3 - Bag / Pot EC, temeprature and pH and EC charts from auto-drain station
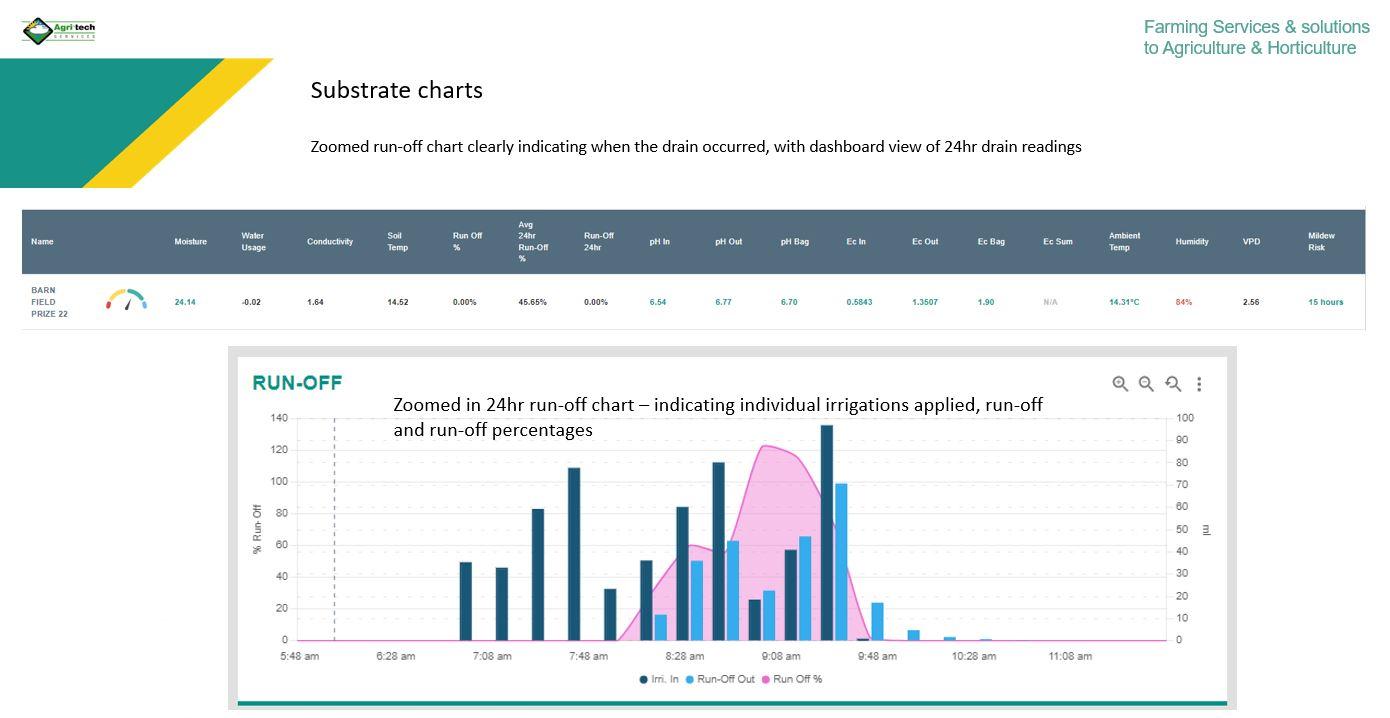
Figure 4 - Run-off chart in detail
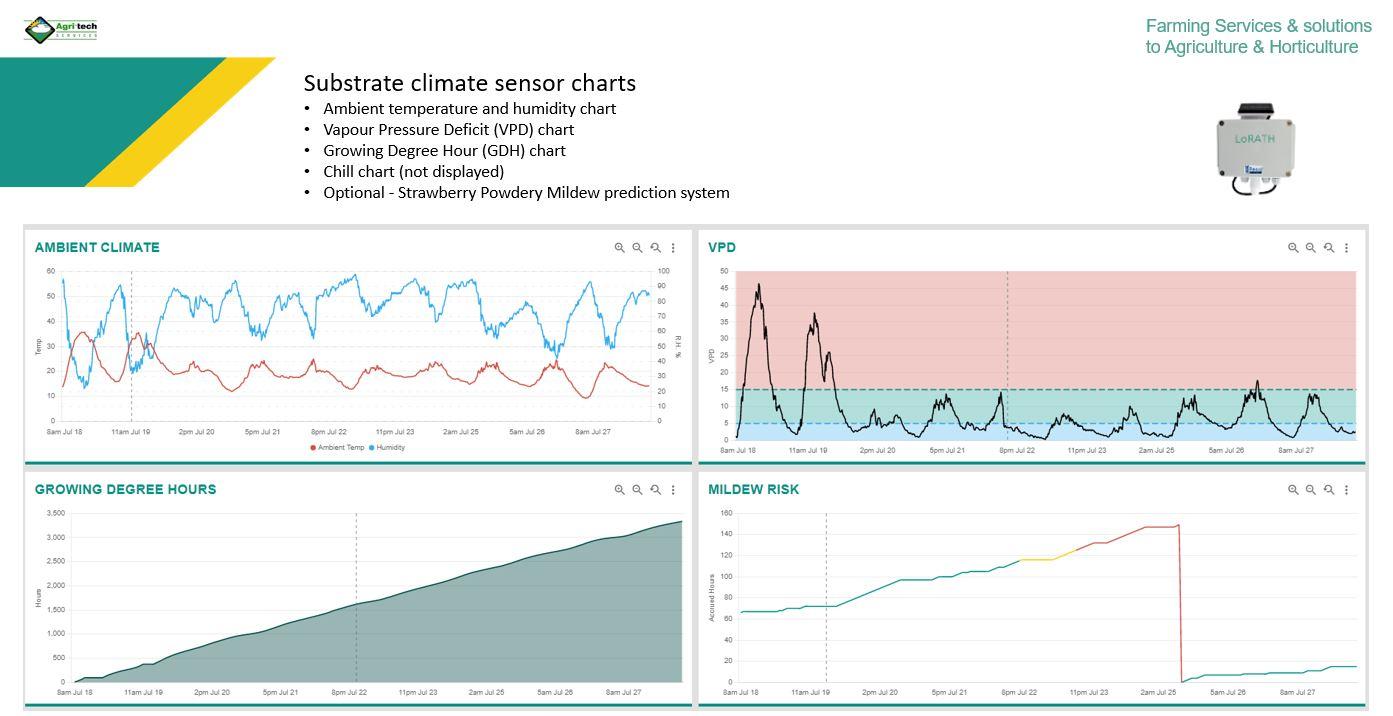
Figure 5 - Climate (temp / rh), VPD chart, GDH chart and Strawberry Powdery Mildew graph


